Hydrogen Diffusion on Si(001)
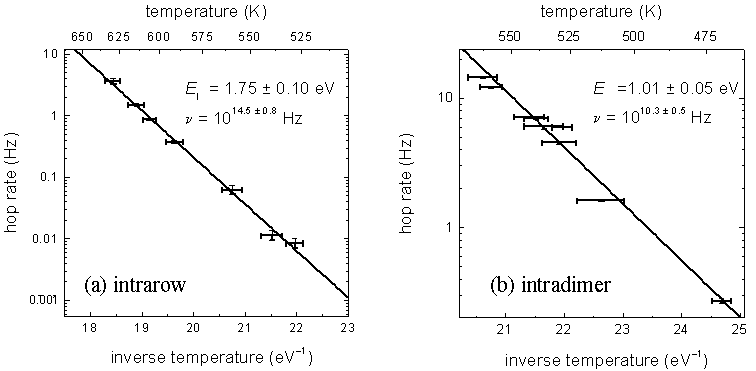
The Scanning Tunneling Microscopy atom-tracking technique is used to follow the individual diffusive hops of single H and D atoms on the Si(001) surface in ultra-high vacuum. Attempt frequencies and activation energies for diffusion along the dimer row (intrarow) and between the atoms of a single Si dimer (intradimer) are extracted. For intrarow H diffusion, an activation energy of 1.75 ± 0.10 eV and an attempt frequency of 1014.5 ± 0.8 Hz are found. For intradimer H diffusion, an activation energy of 1.01 ± 0.05 eV and a low attempt frequency of 1010.3 ± 0.5 Hz are found. The ratios of H to D attempt frequencies for intradimer and intrarow diffusion are also determined.
Introduction
Experiment
Results
Discussion and Conclusions
Activation
Barriers
Attempt Frequencies
The Si(001) surface is of great significance in the semiconductor industry and has been the subject of extensive theoretical and experimental investigations. From a fundamental perspective, H atoms on the Si(001) surface provide a complex model surface dynamics system, with three distinct diffusive channels and three different high-coverage surface reconstructions. The dynamics of H on Si(001) are also of interest as they pertain to Chemical Vapor Deposition (CVD) and nanolithographic processes. Hydrogen passivation of the Si(001) surface is a detriment to CVD processes in which H clogs growth sites. For nanolithography, this passivation and the ability to locally remove H makes it a good atomic resist. For these reasons, H on the Si(001) surface has been the subject of numerous investigations.
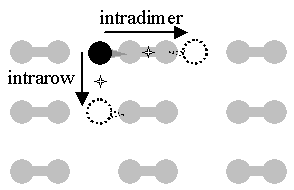
The theoretical work has generally focused on the simplest case, that of a single H atom diffusing on a bare surface. For this, three diffusive channels and their activation energies and attempt frequencies have been studied. The two lower energy channels, intradimer and intrarow, are indicated in FIG. 1. While there is general agreement on the ordering of the energetic barriers, predicted values differ by as much as 1 eV.

FIG. 1 Two diffusive modes for H on bare Si(001): intradimer and intrarow diffusion. The dumbbells represent silicon surface atoms paired as dimers, the black ball represents a hydrogen atom at a potential minimum / bonding site, the dotted balls represent sites to which the hydrogen can diffuse, and the stars represent the potential energy saddle points crossed in diffusion.
In this work, the STM atom-tracking technique is used in its first single atom application. Atom-tracking extends the range of diffusion rates that can be measured by STM and thereby allows a more accurate determination of attempt frequencies and activation energies. Hydrogen and Deuterium diffusion are investigated along the two channels indicated in FIG. 1, intrarow and intradimer. Results are compared to theoretical predictions, the previous experimental work, and vibrational spectroscopy results.

FIG. 2 STM image and schematic of H on the Si(001) - 2×1 surface at Room Temperature. The dimer rows run horizontally. The bright spot is a Si dangling bond produced by H adsorption. It is flanked by frozen-in buckled dimers along the dimer row. Bias = -1.5 V.
Since H adsorption breaks the Si dimer’s p-bond in order to bond to a single Si atom, a dangling bond is produced at the other Si atom of the dimer. For the H atoms in the STM image of FIG. 2, it is this dangling bond that images bright, and the tip locks onto this for atom-tracking. We have previously described our atom-tracker setup in detail. In brief, the STM tip is locked above a feature using lateral feedback electronics, and its diffusive motion is followed for rates up to 20 Hz. Typical atom-tracking data is displayed in FIG. 3. We note that at room temperature no diffusion is observed; this sets an upper bound of 10-3 Hz for tip induced events. For the range of rates measured in this experiment, such an effect would not play a significant role.

Atom-tracking is used to determine the average
H intrarow hop rate as a function of temperature over the range
525 to 625 K. For each temperature, a number of H atoms are
tracked as they diffuse along the dimer rows. Since the H atom is
likely to interact with other surface features such as step-edges
and dimer vacancies, no data acquired while the H atom is near
another feature is used in determining the hop rates. The average
hop rate is expected to follow the Arrhenius relation for a
thermally activated process: ![]() , where r is the rate, E is the
activation energy, n is the attempt frequency, T is the temperature,
and k is Boltzmann’s constant. FIG. 4 (a) shows an
Arrhenius plot constructed from intrarow data. From the slope and
intercept of the fitted line an activation energy of 1.75 ± 0.10 eV and an
attempt frequency of 1014.5 ± 0.8
Hz are found.
, where r is the rate, E is the
activation energy, n is the attempt frequency, T is the temperature,
and k is Boltzmann’s constant. FIG. 4 (a) shows an
Arrhenius plot constructed from intrarow data. From the slope and
intercept of the fitted line an activation energy of 1.75 ± 0.10 eV and an
attempt frequency of 1014.5 ± 0.8
Hz are found.
 FIG.
4 Arrhenius plots for (a)
intrarow and (b) intradimer H diffusion. The solid lines are
weighted fits. From the slopes of these lines, we find the
activation energies, E, and from the
intercepts we find the attempt frequencies, n.
Over the temperature range 470 to 560 K, intradimer diffusion is studied in the same manner. Above this range, the intradimer diffusion rate is high enough that STM atom-tracking cannot resolve individual intradimer hops. FIG. 4 (b) shows an Arrhenius plot constructed from the intradimer data. From the slope and intercept of the fitted line, an activation energy of 1.01 ± 0.05 eV and an attempt frequency of 1010.3 ± 0.5 Hz are found.

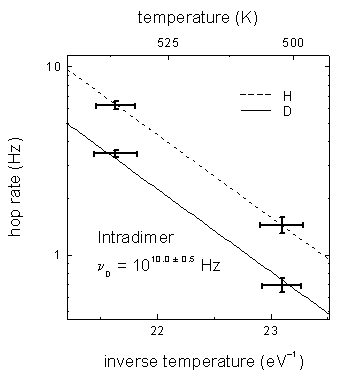
FIG. 5 Arrhenius plot for D intradimer diffusion. Deuterium data is along the solid line and hydrogen data is along the dashed line. The H and D data were acquired simultaneously and the H rates were used to determine the temperature.
Tracking H and D at a few temperatures allows a preliminary determination of relative attempt frequencies. For this purpose, the H rate measurements are used to determine the temperatures. The activation energies (slopes in FIG. 5) are assumed to be the same for the two isotopes since a difference in mass is expected to effect only the attempt frequency (intercept). The ratio of H to D intrarow diffusion attempt frequencies is nH/nD =1.3 ± 0.6 and the ratio for intradimer diffusion is nH/nD = 2.0 ± 0.4.
The two most recent theoretical works agree fairly well with the experimental values. The theoretical work of Bowler et al. employed a tight binding model, and that of Hansen et al. used an empirical, many body potential. Hansen's model is the only one that predicts both intradimer and intrarow diffusion barriers in agreement with the present work. It was built upon a variety of ab-initio data and used a new Si-H interaction potential that had been optimized for the Si surface and to reproduce properties of silicon hydride molecules. The work's central predictions pertain to H and D sticking and abstraction probabilities; diffusion and desorption values are offered as test points for the model.
The implication of the intrarow diffusion results for the H-resist lithographic process is briefly discussed here. The STM H-resist process demonstrates high selectivity, particularly when CVD is the means of material delivery, and very fine pattern definition. Since intrarow diffusion can degrade pattern definition, it sets an upper temperature limit for lithographic processes. Depending on process times and tolerances, this limit can be 50 to 100 K lower than that set by H desorption.
It is informative to compare the results of the
present work with related infrared and electron energy loss
measurements of H-Si bond vibrational frequencies. Chabal et
al. have measured the H-Si bond stretch frequency
at ns=1013.78
Hz, and the bend frequency at nb=1013.26 Hz.
Applying simplifying approximations to simple transition state
theory (STST) allows an order of magnitude comparison between
these values and diffusion attempt frequencies. According to
STST, a transition attempt frequency is  , where N is the number of
equivalent transitions and n is the system's frequency of oscillation perpendicular
(^) or parallel
( || ) to the transition path, at the minimum of the potential
well or the saddle point of the barrier. Assuming that the
perpendicular components are of the same order at the saddle
point and in the well, the term in brackets should be of order
unity. Under this approximation the attempt frequency is ~
, where N is the number of
equivalent transitions and n is the system's frequency of oscillation perpendicular
(^) or parallel
( || ) to the transition path, at the minimum of the potential
well or the saddle point of the barrier. Assuming that the
perpendicular components are of the same order at the saddle
point and in the well, the term in brackets should be of order
unity. Under this approximation the attempt frequency is ~![]() . Applying this to
intrarow diffusion, there are two equivalent transitions, up and
down the dimer row (see FIG. 1), and a reasonable value for nmin || is nb. This
simple model then suggests n » 2nb = 1013.6
Hz.
. Applying this to
intrarow diffusion, there are two equivalent transitions, up and
down the dimer row (see FIG. 1), and a reasonable value for nmin || is nb. This
simple model then suggests n » 2nb = 1013.6
Hz.
According to this simple model, the ratio of H
to D attempt frequencies should be the ratio of the bond
vibrational frequencies. The ratio of H to D bend frequencies is
(nH/nD)bend
= 1.39 ± 0.11, that of H to D intrarow attempt frequencies is nH/nD =1.3
± 0.6 and that of intradimer attempt frequencies is nH/nD = 2.0
± 0.4. These values agree with the expectation that the two
species behave as simple harmonic oscillators differing only by
mass: ![]() .
.
Considering intradimer diffusion, there is only one transition path and the H-Si bond is bent along the dimer. The simple model predicts n » nb = 1013.3 Hz which is three orders of magnitude higher than the observed attempt frequency of 1010.3 ± 0.5 Hz. The prediction is not significantly changed by the calculation of Pnmin^ / Pnsaddle^ from the vibrational frequencies generated by the model of Hansen et al. An upper bound of 0.001 Hz for room temperature intradimer diffusion discounts the possibility of tunneling or tip induced diffusion significantly enhancing rates at the low end of the temperature range in FIG 3(b). An explanation of the low attempt frequency requires further investigation.
D. R. Bowler, M. Fearn, C. M. Goringe, A. P. Horsfield, and D. G. Pettifor, J. Phys.: Condens. Matter 10, 3719 (1998).
U. Hansen and P. Vogl, Phys. Rev. B 57, 13295 (1998).
Y. J. Chabal and K. Raghavachari, Phys. Rev. Lett. 53, 282 (1984); H. Froitzheim, U. Köhler, and H. Lammering, Surf. Sci. 149, 537 (1985). The bend mode values used are the average of values for symmetric and anti-symmetric bending of H on a monohydride terminated dimer.
We thank the National Science Foundation for support under grant DMR-9614125.
Jump to
Atom-Tracking
Piecewise
Diffusion of the Silicon Dimer
Hot STM Labs